 Someone 3x7
- someone3x7
- someone3x7
- America/Los_Angeles
- Yes
- No
 MC-60618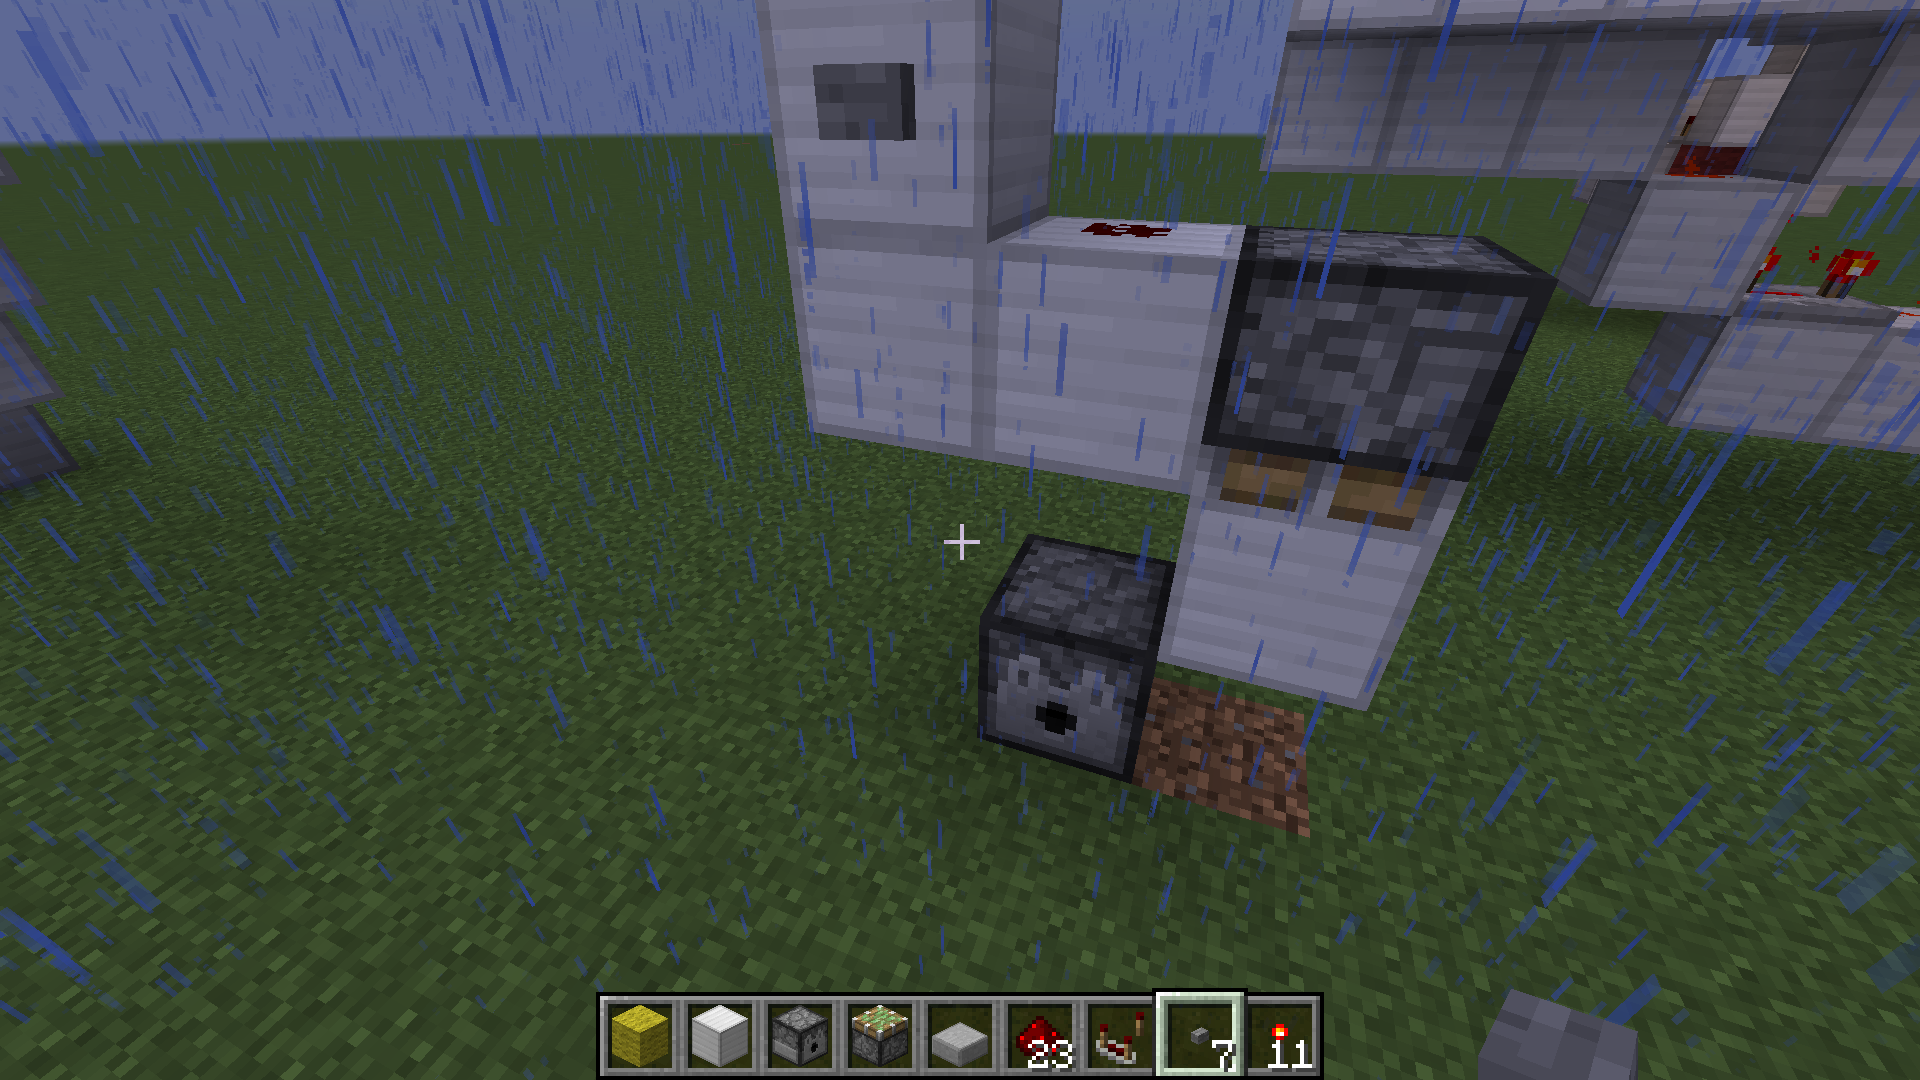

Windows 7 Ultimate 64-bit (6.1, Build 7601) Service Pack 1 (7601.win7sp1_gdr.140303-2144)
CPU: Intel(R) Core(TM) i5-2500K CPU @ 3.30GHz (4 CPUs), ~3.3GHz
Memory: 8192MB RAM
Video: NVIDIA GeForce GTX 465, Driver Version: 9.18.13.3788
Java Version: 7 Update 60 (build 1..0_60-b19)
JVM Arguments: -Xms2G -Xmx4G -XX:ParallelGCThreads=4 -XX:+UseG1GC -XX:MaxGCPauseMillis=500
Windows 7 Ultimate 64-bit (6.1, Build 7601) Service Pack 1 (7601.win7sp1_gdr.140303-2144)
CPU: Intel(R) Core(TM) i5-2500K CPU @ 3.30GHz (4 CPUs), ~3.3GHz
Memory: 8192MB RAM
Video: NVIDIA GeForce GTX 465, Driver Version: 9.18.13.3788
Java Version: 7 Update 60 (build 1.7.0_60-b19)
JVM Arguments: -Xms2G -Xmx4G -XX:ParallelGCThreads=4 -XX:+UseG1GC -XX:MaxGCPauseMillis=500
Windows 7 Ultimate 64-bit (6.1, Build 7601) Service Pack 1 (7601.win7sp1_gdr.140303-2144)
CPU: Intel(R) Core(TM) i5-2500K CPU @ 3.30GHz (4 CPUs), ~3.3GHz
Memory: 8192MB RAM
Video: NVIDIA GeForce GTX 465, Driver Version: 9.18.13.3788
Java Version: 7 Update 60 (build 1.7.0_60-b19)
JVM Arguments: -Xms2G -Xmx4G -XX:ParallelGCThreads=4 -XX:+UseG1GC -XX:MaxGCPauseMillis=500Graphics Fancy, Render Distance 10 chunks, Smooth Lighting Maximum, Max Framrate 100 fps, 3d Anaglyph Off, View Bobing On, GUI Scale Auto, Advanced OpenGL Off, Brightness Moody, Clouds On, Particles All, Fullscreen Off, Use VSync Off, Mipmap Levels 4, Alternate Blocks On, Use VBOs On
After several hours the game becomes less responsive(player movement gets choppy) and uses more memory. FPS seems unaffected and cpu usage never exceeds 35%. As I catch up on the changes in minecraft over the last few years I'm often running tests on mechanics in the background while sleeping or afk. In 1.7.9 and 1.7.10 and even 14w28b this never caused me issue. Even though I've allowed for up to 4gb of memory to be allocated the previous versions never exceeded 2gb allocated. In 14w29b, however, I have noticed that the overall memory usage will have doubled to tap at the 4gb consistently in about 8 hours time. Even if nothing of consequence is occurring in the world(which was last nights test). This may also be related to the visits from Herobrine(which causes an immediate jump in memory usage). However I'm leaning more towards memory leak. Oh, and this is in single player.
After several hours the game becomes less responsive(player movement gets choppy) and uses more memory. FPS seems unaffected and cpu usage never exceeds 35%. As I catch up on the changes in minecraft over the last few years I'm often running tests on mechanics in the background while sleeping or afk. In 1.7.9 and 1.7.10 and even 14w28b this never caused me issue. Even though I've allowed for up to 4gb of memory to be allocated the previous versions never exceeded 2gb allocated. In 14w29b, however, I have noticed that the overall memory usage will have doubled to tap at the 4gb consistently in about 8 hours time. Even if nothing of consequence is occurring in the world(which was last nights test). This may also be related to the visits from Herobrine(which causes an immediate jump in memory usage). However I'm leaning more towards memory leak. Oh, and this is in single player.
Edit: Out of boredom while too sick to do much else I've done some further testing adding incidental items to a fresh world one at a time and letting it run a bit. This issue may be due to the villager farming AI.
After several hours the game becomes less responsive(player movement gets choppy) and uses more memory. FPS seems unaffected and cpu usage never exceeds 35%. As I catch up on the changes in minecraft over the last few years I'm often running tests on mechanics in the background while sleeping or afk. In 1.7.9 and 1.7.10 and even 14w28b this never caused me issue. Even though I've allowed for up to 4gb of memory to be allocated the previous versions never exceeded 2gb allocated. In 14w29b, however, I have noticed that the overall memory usage will have doubled to tap at the 4gb consistently in about 8 hours time. Even if nothing of consequence is occurring in the world(which was last nights test). This may also be related to the visits from Herobrine(which causes an immediate jump in memory usage). However I'm leaning more towards memory leak. Oh, and this is in single player.
Edit: Out of boredom while too sick to do much else I've done some further testing adding incidental items to a fresh world one at a time and letting it run a bit. This issue may be due to the villager farming AI.
After several hours the game becomes less responsive(player movement gets choppy) and uses more memory. FPS seems unaffected and cpu usage never exceeds 35%. As I catch up on the changes in minecraft over the last few years I'm often running tests on mechanics in the background while sleeping or afk. In 1.7.9 and 1.7.10 and even 14w28b this never caused me issue. Even though I've allowed for up to 4gb of memory to be allocated the previous versions never exceeded 2gb allocated. In 14w29b, however, I have noticed that the overall memory usage will have doubled to tap at the 4gb consistently in about 8 hours time. Even if nothing of consequence is occurring in the world(which was last nights test). This may also be related to the visits from Herobrine(which causes an immediate jump in memory usage). However I'm leaning more towards memory leak. Oh, and this is in single player.
Update: the following JVM Arguments fixed this for me,
-Xmx1G -Xms128m -XX:+UseConcMarkSweepGC -XX:+UseParNewGC
After several hours the game becomes less responsive(player movement gets choppy) and uses more memory. FPS seems unaffected and cpu usage never exceeds 35%. As I catch up on the changes in minecraft over the last few years I'm often running tests on mechanics in the background while sleeping or afk. In 1.7.9 and 1.7.10 and even 14w28b this never caused me issue. Even though I've allowed for up to 4gb of memory to be allocated the previous versions never exceeded 2gb allocated. In 14w29b, however, I have noticed that the overall memory usage will have doubled to tap at the 4gb consistently in about 8 hours time. Even if nothing of consequence is occurring in the world(which was last nights test). This may also be related to the visits from Herobrine(which causes an immediate jump in memory usage). However I'm leaning more towards memory leak. Oh, and this is in single player.
Update: the following J
VMArguments fixed this for me,-Xmx1G -Xms128m -XX:+UseConcMarkSweepGC -XX:+UseParNewGC
After several hours the game becomes less responsive(player movement gets choppy) and uses more memory. FPS seems unaffected and cpu usage never exceeds 35%. As I catch up on the changes in minecraft over the last few years I'm often running tests on mechanics in the background while sleeping or afk. In 1.7.9 and 1.7.10 and even 14w28b this never caused me issue. Even though I've allowed for up to 4gb of memory to be allocated the previous versions never exceeded 2gb allocated. In 14w29b, however, I have noticed that the overall memory usage will have doubled to tap at the 4gb consistently in about 8 hours time. Even if nothing of consequence is occurring in the world(which was last nights test). This may also be related to the visits from Herobrine(which causes an immediate jump in memory usage). However I'm leaning more towards memory leak. Oh, and this is in single player.
Update: the following Java 8 Arguments fixed this for me,
-Xmx1G -Xms128m -XX:+UseConcMarkSweepGC -XX:+UseParNewGC
After several hours the game becomes less responsive(player movement gets choppy) and uses more memory. FPS seems unaffected and cpu usage never exceeds 35%. As I catch up on the changes in minecraft over the last few years I'm often running tests on mechanics in the background while sleeping or afk. In 1.7.9 and 1.7.10 and even 14w28b this never caused me issue. Even though I've allowed for up to 4gb of memory to be allocated the previous versions never exceeded 2gb allocated. In 14w29b, however, I have noticed that the overall memory usage will have doubled to tap at the 4gb consistently in about 8 hours time. Even if nothing of consequence is occurring in the world(which was last nights test). This may also be related to the visits from Herobrine(which causes an immediate jump in memory usage). However I'm leaning more towards memory leak. Oh, and this is in single player.
Update: the following Java 8 Arguments fixed this for me,
-Xmx
1G -Xms128m -XX:+UseConcMarkSweepGC -XX:+UseParNewGCAfter several hours the game becomes less responsive(player movement gets choppy) and uses more memory. FPS seems unaffected and cpu usage never exceeds 35%. As I catch up on the changes in minecraft over the last few years I'm often running tests on mechanics in the background while sleeping or afk. In 1.7.9 and 1.7.10 and even 14w28b this never caused me issue. Even though I've allowed for up to 4gb of memory to be allocated the previous versions never exceeded 2gb allocated. In 14w29b, however, I have noticed that the overall memory usage will have doubled to tap at the 4gb consistently in about 8 hours time. Even if nothing of consequence is occurring in the world(which was last nights test). This may also be related to the visits from Herobrine(which causes an immediate jump in memory usage). However I'm leaning more towards memory leak. Oh, and this is in single player.
Update: the following Java 8 Arguments fixed this for me,
-Xmx2G -Xms256m -XX:+UseConcMarkSweepGC -XX:+UseParNewGC
After several hours the game becomes less responsive(player movement gets choppy) and uses more memory. FPS seems unaffected and cpu usage never exceeds 35%. As I catch up on the changes in minecraft over the last few years I'm often running tests on mechanics in the background while sleeping or afk. In 1.7.9 and 1.7.10 and even 14w28b this never caused me issue. Even though I've allowed for up to 4gb of memory to be allocated the previous versions never exceeded 2gb allocated. In 14w29b, however, I have noticed that the overall memory usage will have doubled to tap at the 4gb consistently in about 8 hours time. Even if nothing of consequence is occurring in the world(which was last nights test). This may also be related to the visits from Herobrine(which causes an immediate jump in memory usage). However I'm leaning more towards memory leak. Oh, and this is in single player.
Update: the following Java 8 Arguments fixed this for me,
-Xmx
2G -Xms256m-XX:+UseConcMarkSweepGC -XX:+UseParNewGCAfter several hours the game becomes less responsive(player movement gets choppy) and uses more memory. FPS seems unaffected and cpu usage never exceeds 35%. As I catch up on the changes in minecraft over the last few years I'm often running tests on mechanics in the background while sleeping or afk. In 1.7.9 and 1.7.10 and even 14w28b this never caused me issue. Even though I've allowed for up to 4gb of memory to be allocated the previous versions never exceeded 2gb allocated. In 14w29b, however, I have noticed that the overall memory usage will have doubled to tap at the 4gb consistently in about 8 hours time. Even if nothing of consequence is occurring in the world(which was last nights test). This may also be related to the visits from Herobrine(which causes an immediate jump in memory usage). However I'm leaning more towards memory leak. Oh, and this is in single player.
Update: the following Java 8 Arguments fixed this for me,
-Xmx1G -Xmn128M -XX:+UseConcMarkSweepGC -XX:+UseParNewGC -XX:-UseAdaptiveSizePolicy
I noticed this with Dark Oak trees in specific and have not tested with other tree types.
Situation: Dark Oak trees planted on the border of a chunk (so that the 2x2 trunk will be completely in one chunk) where branches mayl cross the border into another chunk.
Effect: Sometimes the logs for branches that should grow in the neighboring chunk will not appear for several minutes after the tree has grown. I've completely cut down a few to have the tree logs appear up to 10 minutes after the rest the tree has been demolished. However, the foliage seems to grow normally across chunk lines.
While its possible this is related to
MC-62166, I rather doubt it. Where invisible blocks placed can be hit these log blocks do not exist in the world until they decide to grow in.
I noticed this with Dark Oak trees in specific and have not tested with other tree types.
Situation: Dark Oak trees planted on the border of a chunk (so that the 2x2 trunk will be completely in one chunk) where branches may
lcross the border into another chunk.Effect: Sometimes the logs for branches that should grow in the neighboring chunk will not appear for several minutes after the tree has grown. I've completely cut down a few to have the tree logs appear up to 10 minutes after the rest the tree has been demolished. However, the foliage seems to grow normally across chunk lines.
While its possible this is related to
MC-62166, I rather doubt it. Where invisible blocks placed can be hit these log blocks do not exist in the world until they decide to grow in.
If this issue is a duplicate of anything it would be
MC-8471
Windows 7 x64
Java8u31
-Xms1024m -Xmx1024m -Xmn128m -Xincgc -jar minecraft_server.1.8.3.jar noguiWindows 7 x64
Java 64-bit 8 update 31
-Xms1024m -Xmx1024m -Xmn128m -Xincgc -jar minecraft_server.1.8.3.jar nogui
This relates to
MC-38515andMC-3. However, I wish to report a different aspect of the general issue. Which is that no crash report is being generated for this crash during saving the world. Nor does it appear in latest.log. Essentially, if your not watching it, or not able to watch it, it will never be seen.2850The error that randomly appears when saving the world:
ERROR Attempted to append to non-started appender ServerGuiConsole
Exception in thread "Server Shutdown Thread" org.apache.logging.log4j.core.appender.AppenderLoggingException: Attempted to append to non-started appender ServerGuiConsole
at org.apache.logging.log4j.core.config.AppenderControl.callAppender(AppenderControl.java:89)
at org.apache.logging.log4j.core.config.LoggerConfig.callAppenders(LoggerConfig.java:425)
at org.apache.logging.log4j.core.config.LoggerConfig.log(LoggerConfig.java:406)
at org.apache.logging.log4j.core.config.LoggerConfig.log(LoggerConfig.java:367)
at org.apache.logging.log4j.core.Logger.log(Logger.java:110)
at org.apache.logging.log4j.spi.AbstractLogger.info(AbstractLogger.java:1011)
at net.minecraft.server.MinecraftServer.s(SourceFile:379)
at net.minecraft.server.MinecraftServer$2.run(SourceFile:713)This relates to
MC-38134,MC-38515, andMC-32850. However, I wish to report a different aspect of the general issue. Which is that no crash report is being generated for this crash during saving the world. Nor does it appear in latest.log. Essentially, if your not watching it, or not able to watch it, it will never be seen.The error that randomly appears when saving the world:
ERROR Attempted to append to non-started appender ServerGuiConsole
Exception in thread "Server Shutdown Thread" org.apache.logging.log4j.core.appender.AppenderLoggingException: Attempted to append to non-started appender ServerGuiConsole
at org.apache.logging.log4j.core.config.AppenderControl.callAppender(AppenderControl.java:89)
at org.apache.logging.log4j.core.config.LoggerConfig.callAppenders(LoggerConfig.java:425)
at org.apache.logging.log4j.core.config.LoggerConfig.log(LoggerConfig.java:406)
at org.apache.logging.log4j.core.config.LoggerConfig.log(LoggerConfig.java:367)
at org.apache.logging.log4j.core.Logger.log(Logger.java:110)
at org.apache.logging.log4j.spi.AbstractLogger.info(AbstractLogger.java:1011)
at net.minecraft.server.MinecraftServer.s(SourceFile:379)
at net.minecraft.server.MinecraftServer$2.run(SourceFile:713)
No Crash Report forException in thread Server ShutdownNo Crash Report for some Critical Errors
This relates to
MC-38134,MC-38515, andMC-32850. However, I wish to report a different aspect of the general issue. Which is that no crash report is being generated for this crash during saving the world. Nor does it appear in latest.log. Essentially, if your not watching it, or not able to watch it, it will never be seen.
The error that randomly appears when saving the world:ERROR Attempted to append to non-started appender ServerGuiConsole
Exception in thread "Server Shutdown Thread" org.apache.logging.log4j.core.appender.AppenderLoggingException: Attempted to append to non-started appender ServerGuiConsole
at org.apache.logging.log4j.core.config.AppenderControl.callAppender(AppenderControl.java:89)
at org.apache.logging.log4j.core.config.LoggerConfig.callAppenders(LoggerConfig.java:425)
at org.apache.logging.log4j.core.config.LoggerConfig.log(LoggerConfig.java:406)
at org.apache.logging.log4j.core.config.LoggerConfig.log(LoggerConfig.java:367)
at org.apache.logging.log4j.core.Logger.log(Logger.java:110)
at org.apache.logging.log4j.spi.AbstractLogger.info(AbstractLogger.java:1011)
at net.minecraft.server.MinecraftServer.s(SourceFile:379)
at net.minecraft.server.MinecraftServer$2.run(SourceFile:713)This relates to
MC-38134,MC-38515, andMC-32850. However, I wish to report a different aspect of the general issue. Which is that no crash report is being generated for this crash during saving the world. Nor does it appear in latest.log. Essentially, if your not watching it, or not able to watch it, it will never be seen.While the errors themselves are their own bugs, that critical errors can occur without a crash report being generated is its own bug.
I first noticed this with the following random error that appears when saving the world:
ERROR Attempted to append to non-started appender ServerGuiConsole
Exception in thread "Server Shutdown Thread" org.apache.logging.log4j.core.appender.AppenderLoggingException: Attempted to append to non-started appender ServerGuiConsole
at org.apache.logging.log4j.core.config.AppenderControl.callAppender(AppenderControl.java:89)
at org.apache.logging.log4j.core.config.LoggerConfig.callAppenders(LoggerConfig.java:425)
at org.apache.logging.log4j.core.config.LoggerConfig.log(LoggerConfig.java:406)
at org.apache.logging.log4j.core.config.LoggerConfig.log(LoggerConfig.java:367)
at org.apache.logging.log4j.core.Logger.log(Logger.java:110)
at org.apache.logging.log4j.spi.AbstractLogger.info(AbstractLogger.java:1011)
at net.minecraft.server.MinecraftServer.s(SourceFile:379)
at net.minecraft.server.MinecraftServer$2.run(SourceFile:713)

@Someone 3x7: Before After having this issue: Please force a crash by pressing F3 + C for 10 seconds while in-game and attach the crash report (minecraft/crash-reports/crash-<DATE>-client.txt) here.
Please attach the complete output of the "Game Output (Your Minecraft name) " which can be found on the fourth tab of the launcher.
If the launcher closes after game start, please edit your profile and select "Launcher visibility" then, "Keep the launcher open".
That can be a memory issue, see e.g. MC-78028
@Someone 3x7: You're right. Please force the crash at any time.
@Someone 3x7: Nothing to see in the reports except that your graphics card drivers are one version behind. Current one: http://www.geforce.com/drivers/results/81877
![[Mod] Pokechu22](../../../data/avatars/users/92931.png)
So far this only seems to happen to me when flying in creative. Specifically when I press ESC while moving and press Save and Quit while the character is still gliding.
Edit: Which is also to say as long as I always make sure my feet are on the ground in my local LAN game it doesn't freeze on quit.
I can continuously reproduce that in a superflat world with Open To Lan. I think that it has to deal with new chunks being loaded and not yet generated. The reason why you need to be moving in creative is to start loading new chunks, it seems. (Obviously, in a more intensive custom world, gamemode 1 wouldn't be needed because you can just walk a chunk and the new area takes a while to load).
If I'm standing still (even if flying), there isn't any problem. Again, this is on a generic superflat world – Seed manually set to 0, and it's the default grass at layer 4 one. (Also, Game Mode 1)
I cannot reproduce this in an AMPLIFIED world, however. Odd, because I can find unloaded chunks.
I'll investigate further later.
@Kumasasa:
Customized worlds may take some minutes until being saved (chunks are still generated and saved at the same time)
Are you sure about this? 100% sure? Because if they weren't getting generated and saved at the same time, the game would hang forever like it is.
Also, what's the relationship between this ticket and MC-72943? Are they duplicates? Does Minecraft actually make it to the saving chunks screen in this one? (the other one explicitly states it doesn't, but this one I can't tell for sure).
Odd that previous issue didn't come up in my search.
It used to be if you put down a torch (with a block light of 14?), and placed glass next to it the air block on the other side of the glass would still be at 13ish instead of 12. With several pieces of connected glass one could easily get an extra 4 or 5 blocks of light from a single torch. Which allowed for the crafting of functional chandeliers and hidden torch lighting.
Oh this effect was also sometimes referred to as "light piping."
The extension of light with glass was intended as well. Notch promised it would be re-implemented after the lighting code was updated. And those updates were long and bumpy. That much I remember. Please change the status.
I honestly didn't expect it to be this hard to find. I'm still searching off and on as I think of new search criteria. So far all I found were a couple esoteric references from others about glass passing 100% of light they received which may have changed around alpha 1.0.15. Considering I started playing minecraft on my friends computer just before alpha 1.0.12 that would make sense. Anyway, it may take me days, weeks, or months. However, if its still on the internet I will find it.
I've been noticing this in 14w29b whenever I get over about 200 entities loaded. In 1.7.10 200 entities is like a day at the beach.
For whatever reason it wasn't quite as bad this morning. Maybe herobrine didn't stop by for a visit last night. Still some stutter in the movement, however, not nearly as bad. Plus memory usage was much lower than previous mornings. Although, still about 20% more memory actively being used than I am used to seeing. I'll keep tinkering around and see if I can't figure out the difference and get you a better report. In the mean time I'll upload this one.
For comparison this second crash report is what it is like when I first load the world.
One thing I have been playing with in the current snapshot that I've not before is the villager farming. After checking the world I ran last night over head to toe I found about 12 of 24 farmers I set up had gone inactive. They ran out of crops to plant at some point. It may be coincidental, yet, it is the only difference I can find between last night and previous nights.
My machine specs are already listed in the environment section. However, to answer again I've exactly 8gb.
I will try removing the non-standard options one at a time, however, it should make little difference. I was running similar tests on a much more massive scale in 1.7.9 and 1.7.10 under the same jvm version and options without experiencing this type of issue.
Concerning upgrading to a Java pre-release am I to assume Minecraft 1.8 is being developed for that version of java? If so I'll try it, otherwise I'm a bit leery of beta testing for Oracle too.
This appears to be resolved in 14w30b without making any additional changes to my settings or setup. I'll let you know if it crops up again.
My thoughts exactly. This issue cropped up again while I was doing some additional testing on another issue. After disabling all the non-standard java options it actually happened in a matter of minutes instead of hours(Seems I had optimized it for a reason... .. .). So I came back here to get that link for java 8 and found trolls were added to Minecraft.
This latest crash report using Java 8 update 11 was after less than a minute.
Edit: Oh, and there are no villagers in this world. Although, the report should say that too.
Something else I noticed once before and just again now, is that rain seems to temporarily correct this issue. The overall memory usage nearly halves when it starts raining and movement gets quite smooth.
I hate to spam comments like this, but, I also just noticed that some aspects of the game do run much smoother in Java 8 without the non-standard options. Namely water and lava flow much faster.
I wasn't getting the default args and didn't notice they changed. I'll try those. Although, may be tomorrow. Getting sick again, which is unfortunately all too common these days.
One last note with just the args -Xms2G -Xmx4G: it seems to be a cycle its going through. Where occasionally the memory maxes out and it gets laggy. Plus changes in weather seem to reset this cycle(if it is one). When I was using -XX:ParallelGCThreads=4 -XX:+UseG1GC -XX:MaxGCPauseMillis=500 the seeming cycle was likely just slowed down, to where it took longer to reach the high point and stayed there longer.
Ok, so I went ahead and tried those arguments right now and OMG the immediate difference is astounding. I know this isn't a place for feature suggestions but might I recommend a pop-up notification informing people of this change with the option to replace any current arguments?
I'll have to let it run for a day or two to see if this really fixes the issue, but, it looks promising.
Yes, I am speaking of the new default arguments of launcher 1.5. Since I had custom arguments in all my profiles I was unaware of the change until you mentioned it. These arguments do run much better than what I had come up with on my own ages ago. After letting the game run all day afk in a skyblock style world where nothing was occurring(no redstone, no plants growing, no eligible place for mobs to successfully spawn) I can still see that the average memory usage climbs slowly, taking a slight dip when the weather changes. However, at this rate we would likely have to run the game a month straight before it causes any issues. Some day I might get that crazy...
A month might of been an overstatement. Full 24 hours later with nothing happening and its pinging 1gb, This could easily be an issue for servers if it affects them(I've just been doing single player). I'm going to shut it down to try the new snapshot though.
So I think I finally narrowed it down. While the new default garbage collection settings sweep it under the rug a bit they don't make it disappear completely. It appears to be related to light sources(torches, glowstone, lava) in the render-able area. If I change the perspective to an area where there are no light sources in the render-able area whatever is causing the issue gets garbage collected. Also, changes in weather similarly cause it to be collected. Which would explain why 14w30b appeared to fix it at first since the render-able area correctly became much smaller. Also, whatever it is starts to build-up much faster when the game is minimized for a few hours. While I haven't been able to get it to break the game like it used to, I suspect it should be looked into as these kind of bugs have a tendency to fester over time. At this point though I've come to realize I am not being paid enough to put this much work into it
Seed -5033679332523654205 at Biome Size 3 shows an interesting feature at 48, 89, -336. A witch hut in an Extreme Hills Biome. There is a swamp right next door thus I suspect the start point was actually in the swamp. The most interesting fact about this is its the wrong swamp completely. Witch huts should of been spawning in the swamp just north of it instead. Which gives suspicion that the start points for various structures are not being adjusted properly for smaller biome settings causing them to fail to spawn outside the biome they should of been in.
Edit: Release Version 1.8
So far this only seems to happen to me when flying in creative. Specifically when I press ESC while moving and press Save and Quit while the character is still gliding.
Edit: Which is also to say as long as I always make sure my feet are on the ground in my local LAN game it doesn't freeze on quit.
Turns out my previous comment had nothing to do with anything. I've had this crop up more then a few times now in a customized generation map opened to LAN. It is corruption to the map. Once it crops up the issue will continue to occur with that map about once every 4-5 exits. I rolled back a map to a backup before the issue occurred. Spent about 20 minutes launching, opening to lan, and exiting to make sure it was a good map. Then I began retracing my steps one change at a time and relaunching several times after each change. While it doesn't occur every time the one step that thus far has always preceded the corruption was changing/altering the command on a command block with a SuccessCount greater than 0. If I narrow it down any further or find out its something else entirely I'll be back.
Edit: it might be important to note that in this scenario before altering the commands the command blocks in question were cloned from another chunk after being executed once(thus setting the success count).
Sorry I didn't search hard enough and just discovered this is a duplicate. Although
MC-49057is listed as resolved and this definitely still active.I have not noticed this issue in release version 1.8 and can likely be closed.
Seed: 6171657017156404953
{"biomeSize":1,"coordinateScale":684.412,"heightScale":684.412,"lowerLimitScale":512.0,"upperLimitScale":512.0,"depthNoiseScaleX":200.0,"depthNoiseScaleZ":200.0,"depthNoiseScaleExponent":0.5,"mainNoiseScaleX":80.0,"mainNoiseScaleY":160.0,"mainNoiseScaleZ":80.0,"baseSize":8.5,"stretchY":12.0,"biomeDepthWeight":1.0,"biomeDepthOffset":0.0,"biomeScaleWeight":1.0,"biomeScaleOffset":0.0,"seaLevel":1,"useCaves":false,"useDungeons":false,"dungeonChance":8,"useStrongholds":true,"useVillages":true,"useMineShafts":false,"useTemples":true,"useMonuments":true,"useRavines":false,"useWaterLakes":false,"waterLakeChance":4,"useLavaLakes":false,"lavaLakeChance":80,"useLavaOceans":false,"fixedBiome":-1,"riverSize":1,"dirtSize":33,"dirtCount":10,"dirtMinHeight":0,"dirtMaxHeight":256,"gravelSize":33,"gravelCount":8,"gravelMinHeight":0,"gravelMaxHeight":256,"graniteSize":33,"graniteCount":10,"graniteMinHeight":0,"graniteMaxHeight":80,"dioriteSize":33,"dioriteCount":10,"dioriteMinHeight":0,"dioriteMaxHeight":80,"andesiteSize":33,"andesiteCount":10,"andesiteMinHeight":0,"andesiteMaxHeight":80,"coalSize":17,"coalCount":20,"coalMinHeight":0,"coalMaxHeight":128,"ironSize":9,"ironCount":20,"ironMinHeight":0,"ironMaxHeight":64,"goldSize":9,"goldCount":2,"goldMinHeight":0,"goldMaxHeight":32,"redstoneSize":8,"redstoneCount":8,"redstoneMinHeight":0,"redstoneMaxHeight":16,"diamondSize":8,"diamondCount":1,"diamondMinHeight":0,"diamondMaxHeight":16,"lapisSize":7,"lapisCount":1,"lapisCenterHeight":16,"lapisSpread":16}Chunks 1,048,527
Desert Temples (TeDP) 36
Desert (2) 8,776,405
Desert Hills (17) 2,114,925
Desert M (130) 373,837
Jungle Temples (TeJP) 8
Jungle (21) 1,885,829
Jungle Hills (22) 581,632
Jungle Edge (23) 220,255
Jungle M (149) 83,440
JungleEdge M (151) 334
Swamp Huts (TeSH) 18
Swampland (6) 6,305,731
Swampland M (134) 190,826
Ocean Monuments 6
Deep Ocean (24) 42,109,287
Ocean (0) 42,505,490
Villages 101
{"biomeSize":2,...}Plains (1) 17,012,898
Desert (2) 8,776,405
Savanna (35) 5,539,247
Sunflower Plains (129) 1,019,271
Desert Hills (17) 2,114,925
Desert M (130) 373,837
Savanna Plateau (36) 1,231,224
Savanna M (163) 269,179
Savanna Plateau M (164) 175,247
Chunks 1,048,541
Desert Temples (TeDP) 45
Desert (2) 8,658,089
Desert Hills (17) 2,275,605
Desert M (130) 391,174
Jungle Temples (TeJP) 13
Jungle (21) 2,165,108
Jungle Hills (22) 751,055
Jungle Edge (23) 191,766
Jungle M (149) 84,449
JungleEdge M (151) 510
Swamp Huts (TeSH) 25
Swampland (6) 6,528,014
Swampland M (134) 217,493
Ocean Monuments 22
Deep Ocean (24) 38,482,074
Ocean (0) 41,183,823
Villages 104
{"biomeSize":3,...}Plains (1) 17,073,377
Desert (2) 8,658,089
Savanna (35) 5,447,620
Sunflower Plains (129) 1,043,969
Desert Hills (17) 2,275,605
Desert M (130) 391,174
Savanna Plateau (36) 1,329,160
Savanna M (163) 262,296
Savanna Plateau M (164) 155,700
Chunks 1,048,516
Desert Temples (TeDP) 46
Desert (2) 10,979,557
Desert Hills (17) 3,122,669
Desert M (130) 376,211
Jungle Temples (TeJP) 21
Jungle (21) 2,597,107
Jungle Hills (22) 930,390
Jungle Edge (23) 221,566
Jungle M (149) 64,205
JungleEdge M (151) 0
Swamp Huts (TeSH) 32
Swampland (6) 7,106,832
Swampland M (134) 253,887
Ocean Monuments 65
Deep Ocean (24) 35,630,702
Ocean (0) 39,918,479
Villages 126
{"biomeSize":4,...}Plains (1) 17,255,915
Desert (2) 10,979,557
Savanna (35) 7,303,211
Sunflower Plains (129) 1,079,100
Desert Hills (17) 3,122,669
Desert M (130) 376,211
Savanna Plateau (36) 1,927,404
Savanna M (163) 291,983
Savanna Plateau M (164) 192,245
Chunks 1,048,523
Desert Temples (TeDP) 32
Desert (2) 5,560,095
Desert Hills (17) 1,453,974
Desert M (130) 112,843
Jungle Temples (TeJP) 18
Jungle (21) 4,140,864
Jungle Hills (22) 1,512,863
Jungle Edge (23) 411,045
Jungle M (149) 36,901
JungleEdge M (151) 0
Swamp Huts (TeSH) 29
Swampland (6) 6,856,915
Swampland M (134) 260,984
Ocean Monuments 95
Deep Ocean (24) 37,795,675
Ocean (0) 38,719,890
Villages 94
Plains (1) 16,498,840
Desert (2) 5,560,095
Savanna (35) 3,937,678
Sunflower Plains (129) 839,189
Desert Hills (17) 1,453,974
Desert M (130) 112,843
Savanna Plateau (36) 996,430
Savanna M (163) 130,937
Savanna Plateau M (164) 161,608
Each map was initially generated in single player release version 1.8.1. The additional chunks were generated with MinecraftLandGenerator using the Minecraft Server release version 1.8.1. Then I parsed the map data with a python script to get the data above. The total process took about four days per map on my old clunker of an i5.
After working with this a bit and seeing the data I've come to release part of the issue was with my likely flawed expectation that reducing the biome size would produce a compressed map. Overall the temple and village numbers look about right from a seperately randomized perspective. That after 2 weeks of aggressivley searching seeds I couldn't find one that would produce a swamp hut or village within 1k of 0,0 at biome size 1 was possibly just seriously bad luck. Of coarse since swamp huts(previously known as witch huts) are just decorative items now(see
MC-58363) I can not bring myself to care about them anymore. The real concern is with ocean monuments. As this data shows they drasticly taper off with each reduction of the biome size. At biome size 1 ocean monuments are all but non-existant.1) The second number is the total number of columns belonging to that biome.
2) Yes, I set MLG to generate a square 16384 blocks per side in steps of 256 blocks(the default 320 block steps left too many large holes).
3) There is no simple way to verify the placement of structures, and any attempt would of added several days of processing, so no. I did manually verify a fair number of them though in the biome size 1 & 2 maps. Each one I checked was there.
Concerning ocean monuments, what drove me to collect such data was that when manually exploring in this seed I visually noticed many seemingly suitable locations unused.
Concerning your observations, remember this is a single seed and likely too small a sampling to be absolutely sure of such. However, it is interesting enough to note.
Edit: After writing the above I realized I hadn't manually checked any of the villages. After a quick look it seems many of the villages are missing.
Still an issue in 1.8.2-pre7
In addition to
MC-73051people looking at this report might be looking for the much older issueMC-3524. The combination of the two along with this issue being marked "Working As Intended" had me believing for awhile that Witch Huts were no longer meant to work.Still an issue in 1.8.2-pre7
Still an issue in 1.8.2-pre7
This one takes some long testing that I just haven't felt up to for awhile. With the currently recommended and soon to be depreciated jvm gc settings each step takes at least a day. I will check it out again at some point. I've just had other more appealing interests as of late.
I was going to do some additional testing on this tonight, but, am unable to replicate it in 1.8.2-pre7
Managed to make it crash tonight while specifically testing this. Used 4 command blocks with the commands:
/blockdata 1 65 1
{SuccessCount:0}/blockdata 1 65 -1
{SuccessCount:0}/blockdata -1 65 -1
{SuccessCount:0}/blockdata 1 65 -1
{SuccessCount:0}3 connected by repeaters with a torch off the 3rd feeding the 4th with redstone dust.
Edit: When reading that crash report noticed I hadn't updated java in awhile. Updated to 1.8.0_31 and crashed it again.
I was testing a similar bug in 1.8.2-pre7 and found this one was active again.
Used 4 command blocks with the commands:
/blockdata 1 65 1
{SuccessCount:0}/blockdata 1 65 -1
{SuccessCount:0}/blockdata -1 65 -1
{SuccessCount:0}/blockdata 1 65 -1
{SuccessCount:0}3 connected by repeaters with a torch off the 3rd feeding the 4th with redstone dust.
Edit: When reading that crash report noticed I hadn't updated java in awhile. Updated to 1.8.0_31 and crashed it again.
In the background I was downloading about 300gb of video from the security system across the local network. While I was not experiencing any lag or other unusual activity no chests closed the first-time during. Single-player 1.8.2-pre7.
If you read more than the title
MC-2208is pretty much the opposite of this issue.Edit: for clarity,
MC-2208is about being able to place transparent blocks where you shouldn't be able to. Where this issue is about any and all blocks disappearing after being placed near, but not actually in, a place you shouldn't be able to place a block.Tinkered with this a little in release version 1.8.2. It can be recreated fairly easily. When placing a block at foot level in front of you while crouched it occurs at exactly 7/10ths of the block your in(in the direction your facing). Although does require some movement. Facing east standing on 0.7 64 0.5 hold shift and tap forward and back keeping near X 0.7 while trying to place block at 1 65 0. Of coarse its easier in creative where can instantly destroy the block when it does get placed. These steps work anywhere, I just felt east in a positive chunk was easier to explain. East in a negative chunk would be at -0.3 instead, etc
If this issue is a duplicate of anything it would be
MC-8471I originally posted this to
MC-58153before finding this much older issue. This is very easy to recreate. When placing a block at foot level in front of you while crouched it occurs at exactly 7/10ths of the block your in(in the direction your facing). Although does require some movement. Facing east while standing on 0.7 64 0.5 hold shift and tap forward and back keeping near X 0.7 while trying to place block at 1 65 0. Of coarse its easier in creative where can instantly destroy the block when it does get placed. These steps work anywhere, I just felt east in a positive chunk was easier to explain. East in a negative chunk would be at -0.3 instead, etcEdit: release version 1.8.2
Long story short, yes its still an issue. Sorta. I didn't let it run long enough at either 1gb or 4gb to get you a useful crash report, but, I could see the same trend after 4 hours in each. Then I fixed it. I was so incredibly bored at one point that I started writing books for a map where I could fit everything in it in one screenshot. Then I started thinking about how changing the JVM Arguments to the ones recommended in this thread significantly improved the situation. So I went out and dug into all the latest options for Java 8 and came up with this simple set of arguments:
-Xmx1G -Xms128m -XX:+UseConcMarkSweepGC -XX:+UseParNewGC
With these arguments my memory usage never rises above 350mb even after hours on a map that used to launch at 650mb with the default arguments. Its either fixed or swept so far under the rug I'll never see it again. After stitching together the various notes at Oracle that ParNewGC appears in, its apparently a slightly-tweaked multi-threaded drop-in-replacement for CMSIncremental. I tried tinkering with the various settings relevant to ParNewGC, yet, it seems to work best when left to its own devices.
Edit: I've found that with double the memory ParNewGC runs a tad faster and uses less memory. Likely due to an internal survivor optimization that I couldn't force otherwise. -Xmx2G -Xms256m -XX:+UseConcMarkSweepGC -XX:+UseParNewGC
While the settings I listed previously worked fine playing normally, I have an automation script that pushes minecraft to its limits in the course of preparing a large section of the nether for a map idea I've been tinkering with. Them settings buckled when running it. So I tinkered with the jvm arguments awhile and remembered the one note from oracle that stated UseParNewGC as a "drop in replacement" for CMSIncrementalMode. So I tried dropping it into the default settings (-Xmx1G -Xmn128M -XX:+UseConcMarkSweepGC -XX:+UseParNewGC -XX:-UseAdaptiveSizePolicy) and its working pretty good even when I'm playing abnormally.
I've been doing another test on this in 1.8.3. It will be several days before the results are in. However, when adding and debugging code to my script to check that the structures have actually been placed I noticed a few oddities. 1st: While not important to this issue the bottom of a Desert Temple is always outside its bounding box. 2nd: While not all, several of the structures that were not placed had bounding boxes where the lowest Y was 1-2 sections above the highest ground. 3rd: The game tries to place structures outside the created regions. Anyway, just wanted to mention these while it was fresh on my mind. I'll be back when the scripts finish running.
I first started experiencing this in 1.8.3. Thought I was loosing whats left of my mind as was usually minor tasks lost that I thought I did but couldn't be sure. Then some changes I made to a redstone contraption including changing item counts in some hopper and droppers didn't save. I clearly remember doing the math on them item counts thrice. This world has not been touched with an external editor and was never downgraded.
It would be rather difficult to force a crash on a world I've already closed. The problem being that changes from the last time I played were not saved even though it appeared to exit normally. As for memory settings, I have been tinkering with those recently, yet, it occurred when using the default settings as well. At this point I've already deleted everything except my saves and launcher profiles and am keeping an eye on things to see if it occurs again.
While this is for the multiplayer server I think it might be related. When shutting down a server I've noticed an error a couple of times with no corresponding crash-report generated. Once in the middle of saving the players, and once in the middle of saving chunks.
2015-02-25 17:32:41,040 ERROR Attempted to append to non-started appender ServerGuiConsole
Exception in thread "Server Shutdown Thread" org.apache.logging.log4j.core.appender.AppenderLoggingException: Attempted to append to
non-started appender ServerGuiConsole
at org.apache.logging.log4j.core.config.AppenderControl.callAppender(AppenderControl.java:89)
at org.apache.logging.log4j.core.config.LoggerConfig.callAppenders(LoggerConfig.java:425)
at org.apache.logging.log4j.core.config.LoggerConfig.log(LoggerConfig.java:406)
at org.apache.logging.log4j.core.config.LoggerConfig.log(LoggerConfig.java:367)
at org.apache.logging.log4j.core.Logger.log(Logger.java:110)
at org.apache.logging.log4j.spi.AbstractLogger.info(AbstractLogger.java:1011)
at net.minecraft.server.MinecraftServer.s(SourceFile:379)
at net.minecraft.server.MinecraftServer$2.run(SourceFile:713)
Showing in 1.8.3 with nogui.
2015-02-25 17:32:41,040 ERROR Attempted to append to non-started appender ServerGuiConsole
Exception in thread "Server Shutdown Thread" org.apache.logging.log4j.core.appender.AppenderLoggingException: Attempted to append to
non-started appender ServerGuiConsole
at org.apache.logging.log4j.core.config.AppenderControl.callAppender(AppenderControl.java:89)
at org.apache.logging.log4j.core.config.LoggerConfig.callAppenders(LoggerConfig.java:425)
at org.apache.logging.log4j.core.config.LoggerConfig.log(LoggerConfig.java:406)
at org.apache.logging.log4j.core.config.LoggerConfig.log(LoggerConfig.java:367)
at org.apache.logging.log4j.core.Logger.log(Logger.java:110)
at org.apache.logging.log4j.spi.AbstractLogger.info(AbstractLogger.java:1011)
at net.minecraft.server.MinecraftServer.s(SourceFile:379)
at net.minecraft.server.MinecraftServer$2.run(SourceFile:713)
Sorry, for whatever reason that one didn't come up in my searches.
Actually, no that one is still about the errors themselves and not the fact they aren't generating reports or otherwise being logged.
Edit: Due to the nature of the errors I can understand why they aren't being logged, however, when such an error occurs I expect a crash report generated. Which is to say that there are critical error conditions under which crash reports are not being generated is a bug unto itself.
Them two roughly approximate the conditions under which I've noticed this issue.
Now I'm scratching my head. How is reporting a failure in the crash report system a feature suggestion?
Sorry was about to delete the email when noticed you wanted the game output.
I'm still trying to figure how to respond to this without being facetious. That this could be taken as a feature request would mean that the Crash Reporter was not designed or implemented with the intent of catching and reporting crashes.
Exactly, the server is crashing as it saves the world yet no report is generated. If it crashes with the error I noted after "Saving players" it never gets to "Saving worlds" because its dead. Any changes that hadn't been saved to disk are lost because its dead. It crashed, but, no report was generated.
Edit: I apologize if my wording is getting funny. I've a medical condition that is starting to take effect.
Yeah, while I turned up some interesting looking data its not reliable enough to report. An unrelated bug makes getting clean uncorrupt worlds in 1.8.3 nigh impossible. I will say that villages are not being placed in Customized worlds regardless of Biome Size, yet all other structures listed were found at one point or another.
To Michelle Foxcat: while this ticket is still incorrectly linked,
MC-8471is a better place to post concerning it.The frequent world corruption this issue was hiding caused me to quit playing for a long time. Whenever I get back to Minecraft it will be the first thing I check.
Affects 15w49b. Still no minecraft for me.
This is still corrupting my worlds in 15w49b.
I cannot reliably test this or any other issue until
MC-38134is resolved. That said switching to UseParNewGC was a valid workaround/fix that I remember testing extensively. Thus, I doubt further testing is needed on this issue.I've been noticing this as well on a world that hasn't been corrupted yet. It only seems to lag if the clock is connected to a mechanism. It will lag much quicker if that mechanism is also budded.
Actually, updating to JRE 1.8 Update 66 seems to have resolved this for me.
You also need to change your minecraft profile to point to a new version of java since by default it uses its own copy. Use at your own risk, as some java updates will blow minecraft up. It can be useful to make sandbox copies of any java versions that work.
Also, I spoke too soon. Update 66 definitely runs better than update 25, however, I am still getting this issue after awhile.
I started a test world for this issue and so far I've only been able to recreate it with pulsers and 2-on/2-off clocks connected to a bud-able mechanism or command-block. At 3+ on/off with just a clock and 1 mechanism everything runs fine for hours. I've not been able to recreate it with just a clock so I believe the issue is with rapid firing the mechanisms at or below 4 ticks.
Edit: As a note I've updated absolutely everything on my PC. I also recently tested all my hardware, and performed an intensive series of scans for malware. Not for any particular reason its just something I do every few months or so. So all is well with my old clunker.
I've also tested with both the default Java settings and Java 1.8.0_66 with the new version of CMSIncrementalMode(UseParNewGC ). 1.8.0_66 with UseParNewGC runs better, but, the issue still occurs after a bit. So its likely not an issue with Java. My most recent tests were with the default settings.
For awhile now I have wondered why hoppers look for items at all. It seems to me that moving items, which already perform a number of checks for moving, could cheaply search for hoppers.
I am experiencing this in 15w51b.
Edit: Actually might be a slightly different bug than what was reported here. Since it only seems to occur when I ride away in a minecart.
It happens quicker in superflat worlds, yet, I'm also getting it in a normal survival world after a couple hours or so sitting next to a clock. 15w51b
While it may be related I don't think its actually a duplicate since this issue doesn't require mobs. The clock lag can be seen in Peaceful mode with a minecart.
Write an automation script in your favorite language that repeatedly launches and shuts down the server. You will eventually see it along with
MC-38134.Noticed suggestions being tossed around on this in my email. Conceptually dust has no timing, so a segmented list of dust structures would make more sense. If a dust segment/structure gets activated all input components on its list get an update scheduled in the order of distance from the activated output. In certain situations this would cause significantly more memory usage, yet, those situations should be rare. Sorry if my explanation is unclear. Communicating my thoughts is becoming increasingly more difficult.