 MC-215455
Debug graphs cause significant lag
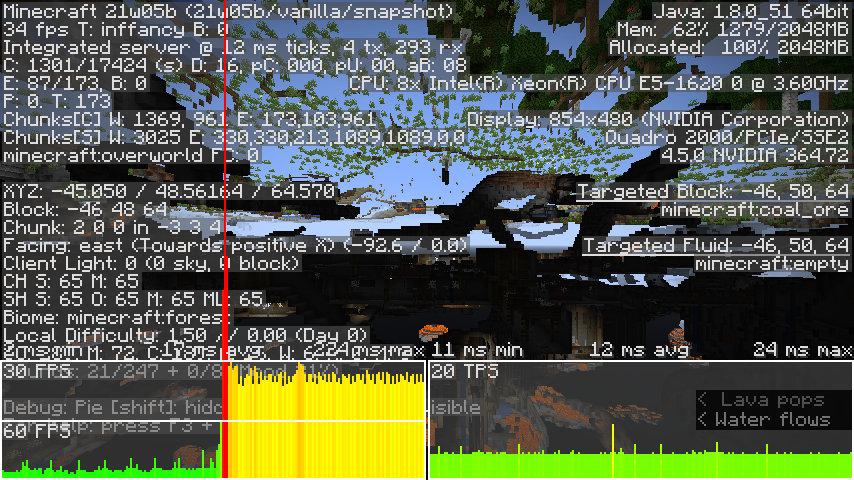
The debug graphs cause a tremendous amount of lag, especially when you first open them. The Alt+F3 graph has dropped my framerate considerably from over 100+ fps to 1 for a second, then around 70, (depending on the version). This makes it difficult to provide accurate fps graphs in screenshots.
It is hard to see in the 21w06a one, but there is a lag spike in the middle there. 21w06a has very bad performance on my computer to begin with, so I've provided some screenshots from other versions as well to show where it is a little more obvious.
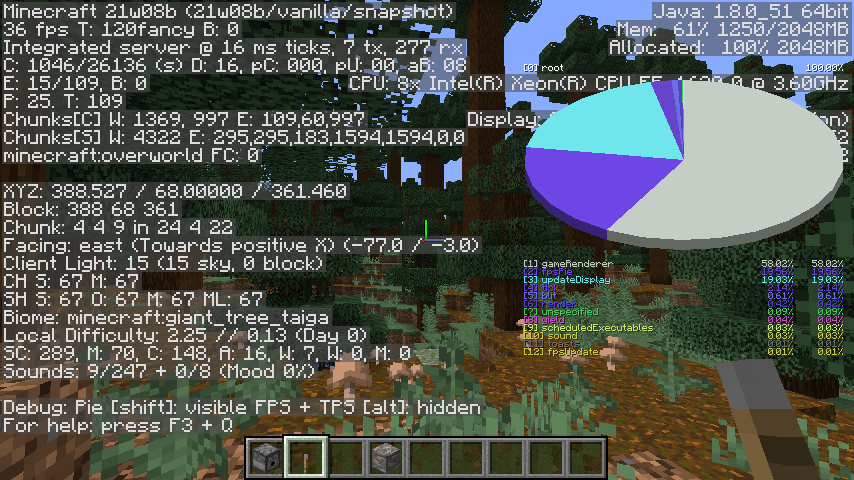
Update for 21w08b: The fpsPie element (the debug pie iteself) was averaging about one-fifth of the debug pie. It at times was up to three-tenths.



Created Issue:
Alt+F3 graph causes significant lag
The Alt+F3 graph causes a tremendous amount of lag, especially when you first open it. Drops my framerate considerably from over 100+ fps to 1 for a second, then around 70. This makes it difficult to provide accurate fps graphs in screenshots.
It is hard to see in the 21w06a one, but there is a lag spike in the middle there. 21w06a has very bad performance on my computer to begin with, so I've provided some screenshots from other versions as well to show where it is a little more obvious.
Attachments1
The Alt+F3 graph causes a tremendous amount of lag, especially when you first open it. Drops my framerate considerably from over 100+ fps to 1 for a second, then around 70. This makes it difficult to provide accurate fps graphs in screenshots.
It is hard to see in the 21w06a one, but there is a lag spike in the middle there. 21w06a has very bad performance on my computer to begin with, so I've provided some screenshots from other versions as well to show where it is a little more obvious.
The Alt+F3 graph causes a tremendous amount of lag, especially when you first open it. Drops my framerate considerably from over 100+ fps to 1 for a second, then around 70. This makes it difficult to provide accurate fps graphs in screenshots.
It is hard to see in the 21w06a one, but there is a lag spike in the middle there. 21w06a has very bad performance on my computer to begin with, so I've provided some screenshots from other versions as well to show where it is a little more obvious.
![[Mod] Chandler](../../../data/assets/gravatar/triwonder81.png)
Alt+F3 graph causessignificant lagAlt+F3 and Shift-F3 graphs cause significant lag
The
Alt+F3graph causesa tremendous amount of lag, especially when you first openit. Dropsmy framerate considerably from over 100+ fps to 1 for a second, then around 70. This makes it difficult to provide accurate fps graphs in screenshots.It is hard to see in the 21w06a one, but there is a lag spike in the middle there. 21w06a has very bad performance on my computer to begin with, so I've provided some screenshots from other versions as well to show where it is a little more obvious.
The debug graphs cause a tremendous amount of lag, especially when you first open them. The Alt+F3 graph has dropped my framerate considerably from over 100+ fps to 1 for a second, then around 70, (depending on the version). This makes it difficult to provide accurate fps graphs in screenshots.
It is hard to see in the 21w06a one, but there is a lag spike in the middle there. 21w06a has very bad performance on my computer to begin with, so I've provided some screenshots from other versions as well to show where it is a little more obvious.
Alt+F3 and Shift-F3graphs cause significant lagDebug graphs cause significant lag
![[Mod] violine1101](../../../data/avatars/users/92858.png)
The debug graphs cause a tremendous amount of lag, especially when you first open them. The Alt+F3 graph has dropped my framerate considerably from over 100+ fps to 1 for a second, then around 70, (depending on the version). This makes it difficult to provide accurate fps graphs in screenshots.
It is hard to see in the 21w06a one, but there is a lag spike in the middle there. 21w06a has very bad performance on my computer to begin with, so I've provided some screenshots from other versions as well to show where it is a little more obvious.
The debug graphs cause a tremendous amount of lag, especially when you first open them. The Alt+F3 graph has dropped my framerate considerably from over 100+ fps to 1 for a second, then around 70, (depending on the version). This makes it difficult to provide accurate fps graphs in screenshots.
It is hard to see in the 21w06a one, but there is a lag spike in the middle there. 21w06a has very bad performance on my computer to begin with, so I've provided some screenshots from other versions as well to show where it is a little more obvious.
Update for 21w08b: The fpsPie element (the debug pie iteself) was averaging about one-fifth of the debug pie. It at times was up to three-tenths.
![[Mod] ampolive](../../../data/avatars/users/18949.svg)
Can confirm in 21w42a.
![[Mod] Michael Wobst](../../../data/avatars/users/37868.png)
![[Helper] Johnibur](../../../data/avatars/users/28381.png)
Can confirm.
Can confirm. Also for some reason opening the debug menu drops my fps from 100+ to 30
Can confirm in 21w42a.
Can confirm in 1.18. The debug screen even without the graph halves my FPS.
Yeah the debug screen in general does lag a lot but the graphs lag it even more